Subject Code & Title :- LA022354 Interpret And Use Financial Statistics And Tools
Assessment Type :- Assignment 4
What you have to do
This assessment consists of 6 Tasks. Each task assesses different elements of competencies.
You are required to complete every question in each task in the assessment.
LA022354 Interpret And Use Financial Statistics And Tools Assignment

Competency requirements :-
Students must achieve a satisfactory result in each element to pass this assessment.
If you do not satisfactorily complete any of the questions (i.e. you do not achieve the nominated passing mark for that question then you will be required to do a gap assessment or a resubmit of the entire assessment. Please note you will not be able to attempt the assessment more than twice.
To achieve a satisfactory result in these topics you must achieve the following results for each question:
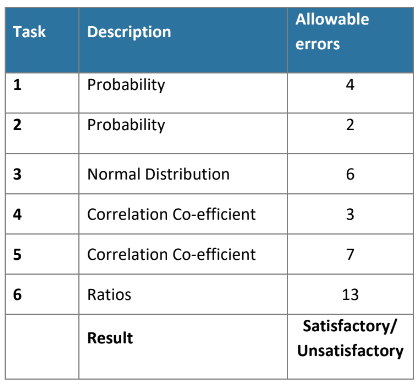
Task 1
Part A
Define the following statistical terms. Your answer should be a minimum of 10 words but no longer than 100 words.
a. Probability
b. Event
c. Sample space
d. Venn Diagram
e. Mutually exclusive event
Part B
Using the Venn diagram below, answer the following questions regarding the sport played by 40 school athletes.
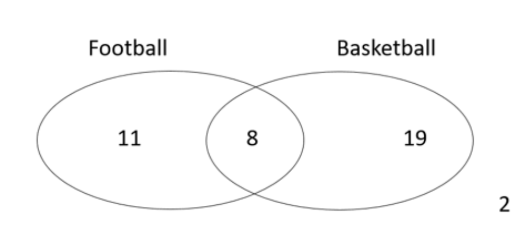
a. How many students play football?
b. How many students play only basketball?
c. How many students play neither football nor basketball?
d. What is the probability that a randomly chosen student from the group is only a football player?
e. What is the probability that a randomly chosen student from this group is a basketball player?
Task 2
All customers of Amazonia purchase online. When buying they provide customer details including sex and age. The profile of Amazonia has been determined as:
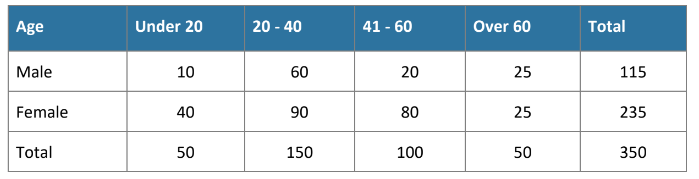
From the table above, answer the following question (show all your workings):
a. What is the probability that the next customer order to be received will be from a male?
b. What is the probability that the next customer who orders is 40 years or older?
c. What is the probability that the next customer order received is from a female between 20 and 40?
d. Assuming that a customer only ever places one order. What is the probability that the 1st customer order received is from a female and the 2nd customer is a male?
e. Assume that it is know that the next customer to place an order is male. What is the probability that this customer is under 20 years of age?
Task 3
Part A
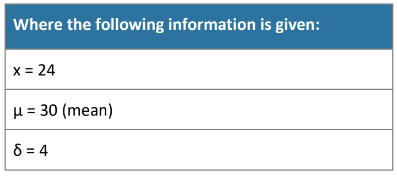
a. Calculate the Z score of event x.
b. For the Z score in a), what is the proportion (or probability) of the distribution curve between the mean and x?
c. For the Z score in a), what is the proportion (or probability) of the distribution curve greater than event x?
d. What is the proportion (or probability) of the distribution curve between 24 and 28?
Part B
Historical analysis has identified that the time taken to prepare a new will has a mean of 170 minutes and a standard deviation of 25 minutes.
a. The finance manager is reviewing the charges for preparing a will and wishes to know what proportion of all wills can be prepared in less than 200?
b. If the charge out rate for preparing wills is $360 and the cost of preparation is $1.50 per minute what is the break-even point in hours to prepare a will and what proportion of the wills will make a loss?
c. If the charge out rate for preparing wills is now $350 and the cost of preparation is $1.50 per minute what proportion of the wills will make at least $125 profit?
LA022354 Interpret And Use Financial Statistics And Tools Assignment
Task 4
Part A
Explain the following terms:
a. Correlation
b. Correlation co-efficient of zero (r = 0)
c. Scatter diagram
d. Regression
Part B
The correlation coefficient between the price of petrol in Australia and the cost of a barrel of crude oil is +0.83.
a. Which is the independent variable and which is the dependent variable?
b. What does the correlation coefficient suggest about the relationship between price of petrol and the cost of a barrel of crude oil? Provide reasons to justify your answer.
Task 5
A random sample of eight drivers who had similar minimum car insurance cover were selected from a small town insured with a company. The following table lists their driving experiences (in years) and monthly car insurance premiums (in dollars):
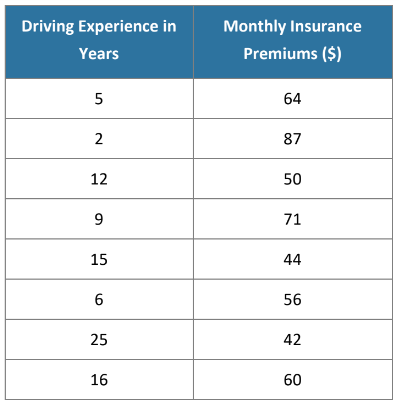
Part A
Using the functionality within excel, produce a scatter diagram from the data above. Insert the graph into the space provided in the answer template.
Part B
Referring to the scatter diagram you produced above:
i. What information does the diagram give you regarding the relationship between the data and
ii. what would you expect the correlation coefficient to be (positive or negative)
Explain your answer in terms of the two variables in the diagram.
Part C
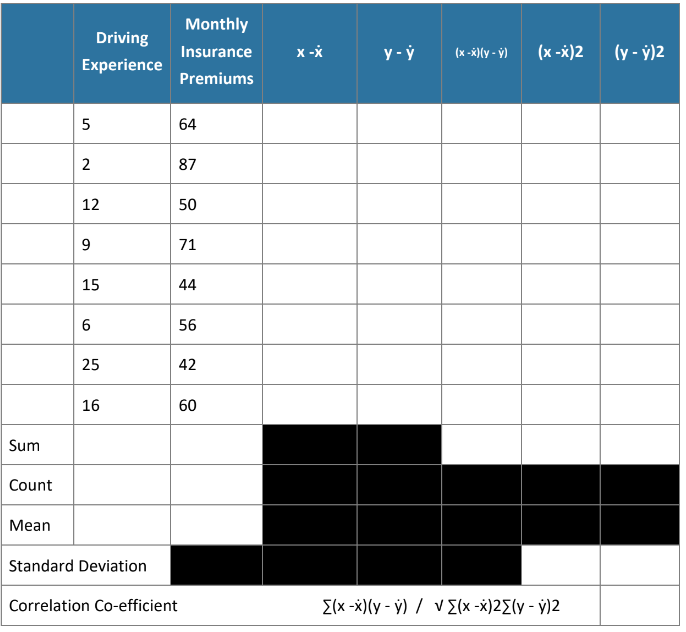
Complete the table below and answer the following questions (show all your workings)
LA022354 Interpret And Use Financial Statistics And Tools Assignment
a. What was the mean driving experience (show your workings)?
b. What was the mean value of monthly car insurance premiums (show your workings)?
c. What was the correlation co-efficient between driving experience and the monthly
car insurance premiums (show your workings)?
d. What does the correlation coefficient result you calculated suggest about the relationship driving experience and the monthly car insurance premiums? Provide reasons to justify your answer.
Task 6
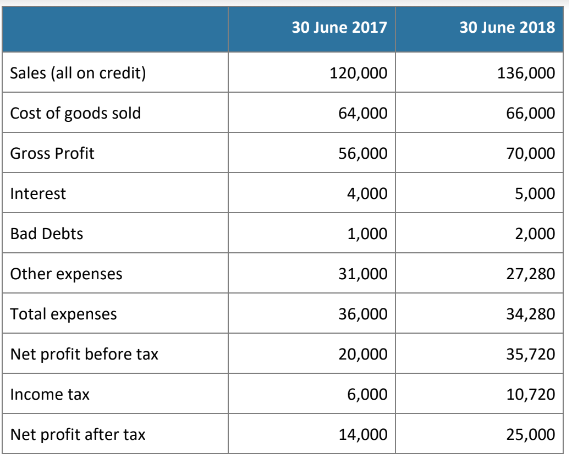
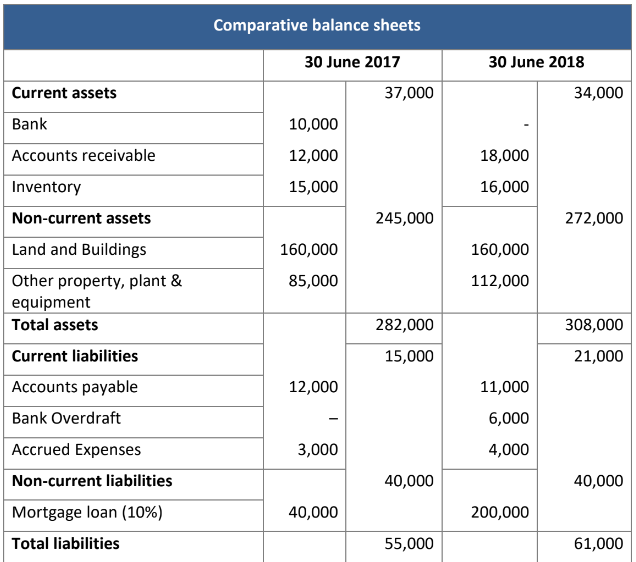
The following information is a condensed version of the financial statements for Reservoir Dogs Food Supply Company for the two years ended 30 June 2017 and 30 June 2018.
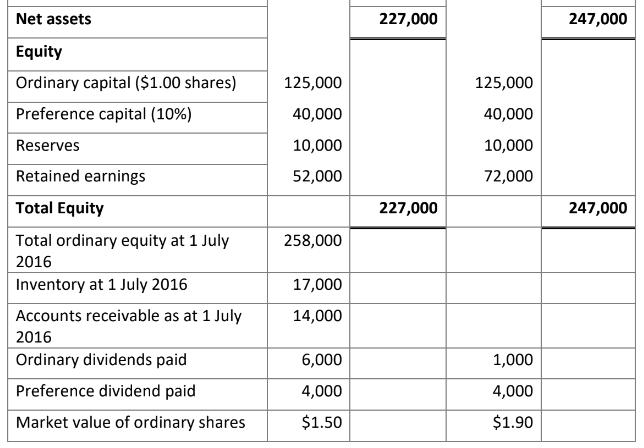
Required
1 Calculate the following ratios for each year:
a Liquid ratio
b Net profit ratio
c Times interest cover
d Earnings per share
e Price Earnings Ratio
f Return on equity (shareholder’s funds)
g Debtor collection period (turnover rate)
h Inventory turnover
2 Compare and explain the link between the movement in the earnings per share and the price earnings ratio. What may explain the difference in the movement in these two ratios?
3.Give two actions that the business may have taken to improve the debtor turnover rate.
4.Describe four ways of ensuring the security of electronic data.
ORDER This LA022354 Interpret And Use Financial Statistics And Tools Assignment NOW And Get Instant Discount

Read More :
