Unit Title :- Business Analytics Coding
Assessment Type :- Assignment 1
Task Description :
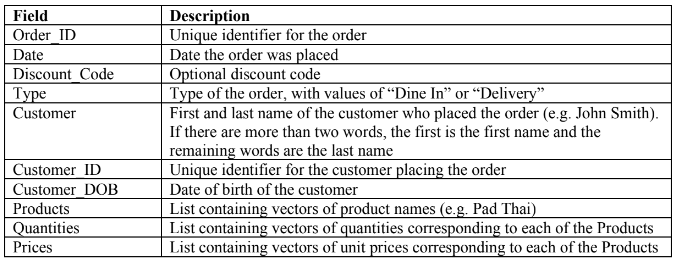
A nearby restaurant collects data from the orders placed by customers and saves it in a single RDS file called raw_orders.rds. RDS files contain R objects and can be loaded into R using the read RDS function. The file you have been provided with has data for the months of January 2021 to March 2021 and contains the following fields.
Business Analytics Coding Assignment

James thinks that the current ordering system is not scalable as the business grows and collects more data. He would like to have a program that cleans the data in the RDS file and moves it to a database with multiple tables – one for customers, items in the order and overall order information.
James has asked you to help with this project by writing an R program to clean the data in the raw_orders RDS file and split it into three data frames so that it is ready to be put into a database. Specifically he would like you to:
• Extract the unique customer names, IDs and birth dates and place them into a data frame containing customers’ information. Break each customer’s name into first and last name columns.
Additionally use the birth date column to create an age column that reports the customer’s age in years whole number.
• Extract the product names, quantities and unit prices and place them into a data frame containing the items in each order (i.e. one row for every item in an order). Each row in the data frame should be associated with an order identifiable by the order ID column.
• Create an orders data frame containing summary information about each order. Specifically, the data frame should contain the order ID customer ID of the customer purchasing the order order type discount code and the date the order was placed. Additionally, the orders data frame should contain fields calculating the delivery fee if any sub-total before discount,value of the discount (if any) sub-total after discount GST and final total of each order.Dollar figures should be rounded to two decimal places.
• Save all three data frames as separate CSV files.
To show you what you are trying to achieve, James has manually prepared sample CSV files for the customers orders and items in orders data frames using the first 50 rows in the raw_orders.rds file. It is a good idea to check that your final data frames match these samples. Additionally, if you are struggling to create the final data frames and want to work on other parts of the project, you can use these sample CSV files to complete them.
Business Analytics Coding Assignment
In order to help you with your tasks, James has provided you with the following business rules.
• An order can be placed for either Dine In or Delivery. Dine in is a free service while delivery will incur an additional $3.99 delivery charge
• For orders containing more than 2 items, a 10% discount is automatically applied. This should be reported automatically by the program as LARGE10 in the Discount Code field (i.e. the user won’t enter LARGE10, the program needs to do that)
• The system should also support the discount codes of: OFF5 for 5% off the total price, and OFF 15 for 15% off the total price
• If a customer orders more than 2 items and uses a discount code, only the greatest discount should be applied and put in the Discount Code field
• There is a Goods & Services Tax (GST) of 10% that has to be applied to the sub-total after any discount has been factored in
While James is hiring someone else to design the front end (user interface) of a related web application, James would like you to build some R functions that will be used to pass information to the application. The functions that he would like you to create are detailed below.
• Customer Reporting – this function will be used to generate a report about a particular customer. It will take in a customer ID, start date and end date (both dates will be in YYYY- MM-DD format) and then print out information about the customer’s orders between(inclusive) the start and end dates. Specifically, it will print out the customer’s full name, age, number of orders, mean/median order totals, percentage breakdown of the order types and percentage break down of products. You can assume that the “customers”, “items in orders” and “orders” data frames are loaded globally (i.e. you can refer to them in your functions without passing them in as parameters). If the function finds no orders for a given customer ID and date range, it should tell the user whether or not the customer exists in the data.
• Plotting Data – James wants to create a graph showing the breakdown between order types discounts and the products purchased. He has already written some R code that will create the graph shown below. How ever he needs to get the data into the format required by the plotting code.
James wants you to create a function that takes in the items in orders and orders data frames and returns the data required by the plotting code. The plotting code, required data format (i.e. what your function needs to return) and plot output are shown below to help you test your function.
Business Analytics Coding Assignment
Note that NA values for the Discount_Code field are to be replaced by values of NONE to indicate that no discount has been used for that order.
Plotting Code :
plotting_data <- expand_items_in_orders(items_in_orders, orders)]
ggplot(plotting_data, aes(x = Product, fill = Discount_Code)) +
geom_bar() +
coord_flip() +
facet_wrap(~Order_Type) +
xlab(“Product”) +
ylab(“Count”) +
ggtitle(“Product by Discount and Order Type”)
Data Format (on all data – first 6 rows)

Plot Output (on all data)

Finally, James has some specific questions that he would like you to answer about the current data set.
1. What’s the breakdown of discounts applied to orders (e.g. how many orders have no discounts, OFF 5, OFF 15 and LARGE 10)? Report the breakdown in terms of both frequency (count of each value) and relative frequency (proportion of each value).
Business Analytics Coding Assignment

2.What’s the minimum, maximum, mean and median of the order totals?
3.What’s the total revenue of the restaurant? What is the total revenue for orders with a Discount Code of “LARGE 10”?
4.Who are the top 10 most valuable customers (i.e. customers with highest lifetime order total)?
5.What is the highest revenue product (i.e. product with highest total lifetime order total)?
6.Print the total revenue of the restaurant for each day in February 2021. Identify the best and worst days, as well as the difference in revenue between them.
In terms of structuring your solution, James has given you the following guidelines.
• Create an R project to contain your solution
• Create a sub-folder to contain the data files
• Put the data cleaning and splitting code in an R file
• Put the customer reporting function and plotting data function code in a separate R file
• Put the answers to James questions in an RMD file. Compile the RMD file into a HTML document.
ORDER This Business Analytics Coding Assignment NOW And Get Instant Discount