Subject Code & Title :- 6002HLS Structure And Requirement
Assessnment Type :- Assignment 2
Weight :- 60%
6002HLS Structure And Requirement Assignment

Part I Requirement and Questions Set A
The data are in an SPSS sav file:
Background :-
Unstable angina UA is an irregular type of angina pectoris Yeghiazarians Y Braunstein JB Askari A & PH 2000) and a type of acute coronary syndrome ACS Wiviott S. D. & Braunwald E 2004. Over the past years how ever the quality of life (QoL) of patients with chronic diseases such as cardiovascular disease has also become an important indicator of successful clinical practice Donald 2009.
6002HLS Structure And Requirement Assignment
Percutaneous coronary intervention PCI has been known as a break through method that has become a frequently used revascularization technique for improving health of patients with CAD (Grech ED, 2003). Some studies have also shown that PCI improves the QoL of CAD patients. A study of 65 patients receiving PCI found that QoL improved significantly over time in six out of the eight domains and all other domains showed an increase at 3 month follow up. More over all five domains of the Seattle angina question naire improved significantly how ever the angina stability score at 3-month follow-up was lower than the baseline value Man Sin Wong & Sek Ying. Chair 2007). A 2008 study comparing PCI and optimal medical therapy alone showed remarkable improvements in health out comes during the follow up period in the PCI group but these disappeared after 36 months (William et al., 2008).
Objective :- This study aims to assess the effect of PCI on QoL among patients with un stable angina after PCI. Factors contributing to QoL are also investigated.
Design and Subjects :-
This is a quasi experiment among 154 patients attending a national heart institute in Vietnam in 2016-2017 half of which is in intervention group and the remaining in control group. The intervention group received percutaneous coronary intervention (PCI), while the control group received other treatment.
Please answer the research questions using the subtitles below. Please do not create your own assignment structure). In this data set we only extracted those variables needed for this assignment.
You are asked to answer the following research questions and objectives:
(1) In the Pre intervention time are participants in the intervention group different from the control group in demographic information including: sex age group occupation education smoking and drinking? (Descriptive analysis and bivariate)
(2) Over all is there any difference between intervention and control group participants in the age bmi and 10 quality of life variables in the pre intervention time? Choose a statistical test based on the statistical assumptions check)?
(3) In the Pre-intervention time do the three levels of occupation retired employed and unemployed show different levels of age bmi and 10 quality of life variables in the pre-intervention time?
Notes: Occupation is a categorical variable while age bmi and quality of life variables are continuous variables.
(4) Do the age bmi and 10 quality of life variables correlate with each other?
(5) Is the over all quality of life higher score the better quality of life predicted by bmi social functioning mental health and physical functioning quality of life when age group and sex are controlled for in the analysis?
6002HLS Structure And Requirement Assignment
Notes :- over all quality of life is a continuous variable where higher scores indicate better quality of life.
You will need to choose an appropriate statistical analysis test for this research question. Your independent variables bmi social functioning mental health and physical functioning quality of life are continuous variables. Age group and sex are confounding factors. Both age group and sex are categorical variable.
(6) In the Pre intervention time is the smoking predicted based on bmi mental health quality of health physical health quality of life general health quality of health and drinking when sex and age group are controlled in the analysis?
Notes :
Smoking is categorical data type with 2 levels for this we are predicting who are more likely to smoke. All independent variables are continuous/interval variables except for drinking dichotomous. Participant age group categorical and sex categorical are confounding factors.
You need to follow the following structure to answer the above research questions please do not create your own assignment structure.
Structure :
For question 1 you need to provide the answers for the structure below:
1.SCIENTIFIC HYPOTHESES: Provide research hypotheses that will address the research questions.
2. Provide a name of the statistical test, and a justification of the statistical test(s) that will be appropriate to test the hypotheses.
3.Provide a statement of the levels of significance that you will use to test the hypothesis.
4.Execute statistical analyses, present results in publication format
Execute the appropriate analysis and interpret the results in a short paragraph or two. These include:
a. using tables to present descriptive analysis results,
b. overall statistical results and p value, and
c. interpretation of the results.
For question 2, you need to:
a. Provide rationale of the data analysis method you will use variable name and specific variable type normality test.
Please choose either parametric test or non parametric test depending on the normality test results. Normality tests need to be done by checking Skewness and Kurtosis to be considered normal distribution both Skewness and Kurtosis need to be within the range of -3 to +3).
6002HLS Structure And Requirement Assignment
b. Conduct the statistics analysis, present the descriptive statistics and a bivariate analysis results in a table to summarise the data in all 12 outcome variables including age bmi and 10 quality of life variables in the Pre-intervention.
c. Discuss tables of overall results and meaning of the results in a paragraph or paragraphs. Please describe the direction of the difference.
For question 3, you need to:
1. Provide a rationale of the data analysis method you will use for this question (i.e., specific variable type, number of groups).
2. Conduct the analysis summarise the difference between the three levels of occupation in the variables of age bmi and 10 quality of life variables present the results in a publication table format.
3. Describe the results in the table and meaning of the results. Please describe the direction of the post-hoc comparisons (e.g., which group is more or less than another).
For question 4, you need to:
1. Provide a rationale of the data analysis method you will use for this question (i.e., variable type, normality test results).
2. Conduct the data analysis, summarise the relationships among 12 variables and present the results in a table using publication format.
3. Describe the results in a short paragraph or two.
6002HLS Structure And Requirement Assignment

For Question 5 you need to:
i. Provide rationale of the data analysis method you will use for this question (i.e., variable type normality test results).
ii. Conduct the appropriate data analysis summarise the relationship of the over all quality of life (higher score the better quality of life and bmi social functioning mental health and physical functioning quality of life when age group and sex are controlled for in the analysis. Present the results in a table and describe the results in a paragraph or two.
iii. Describe meaning for the statistical level of significance and overall results for the relationship of the overall quality of life higher score the better quality of life and bmi social functioning mental health and physical functioning quality of life when age group and sex are controlled for in the analysis.
For question 6, you need to answer the following questions:
1. Provide rationale of the data analysis method you will use for this question variable type and adequate cell number. Provide names of dependent and independent variables.
2. Conduct a statistical analysis, use tables in publication format to summarise relationships of the smoking and bmi physical quality of life mental quality of life general health quality of life continuous and drinking dichotomous when sex and age group are controlled in the analysis.
3. Describe whether smoking status is predicted by bmi, physical quality of life mental quality of life general health quality of life continuous and drinking dichotomous when controlled for age group and sex
Discussion Section
You need to:
1. Summarise the main research findings.
2. Interpret the meaning of the results and discuss the reason of the significant results for example the significant difference or relationship of suggests that…)
3. Discuss implications or future of the research based on the results in this study.
Note. For table presentations, you need to extract data from SPSS output to create your own table to summarise the results in publication format please refer to the power point slides for the publication format. Please do not copy and paste the results from SPSS outputs.
Part II Questions
SET A: Assignment 2: PART II
Please answer the following questions a correct answer to each question equals 1 mark by due date and your answers will be automatically saved in the link. We will collect these answers as part of overall assessment.
6002HLS Structure And Requirement Assignment
1.You are performing a linear regression analysis to examine association of some factors with the level of total cholesterol in the blood (mmol/L) among elderly people in Queensland. Two predictor variables are included in the model: BMI (kg/m 2 ) and frequent physical activity (yes/no), and the following is obtained:
Total cholesterol = 3.20 + 0.10 x BMI – 1.03 x Frequency physical activity=Yes.
a. Is the simple or multivariable regression model?
b. Interpret the effect of BMI and frequent physical activity on total cholesterol? two decimal places accepted!?
2.Find the estimated slopes (β 1 ) and intercepts (β 0 ) from the following two fitted simple linear regression models i = β 0 + β 1 x i and fill the results in the following table:

3. For comparing means of two groups, independent two-sample t-test is used. From the followings, select the appropriate number of degrees of freedom of the test statistic when the number of observations of the two groups are 20 and 45.
4.What is the H 0 and H 1 hypothesis for regression coefficient 1 in the following model?
5.The results of the model analysis for LDL-C (low density l) conditional on Sex (0 as female and 1 as male) and BMI (kg/m 2 ) are presented below?
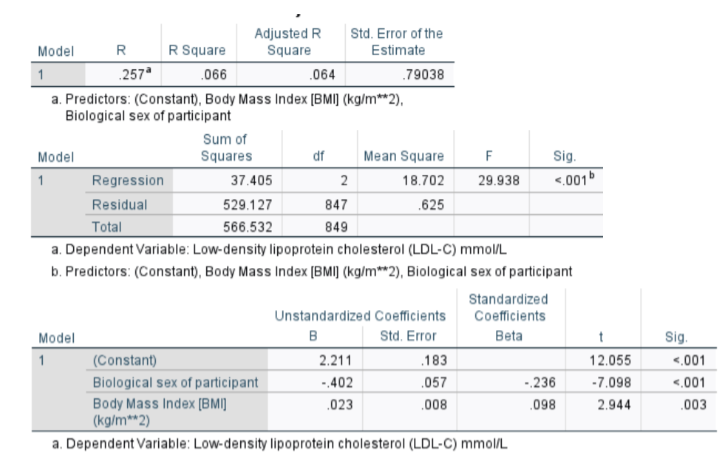
a. What is the name of regression model?
b. Write an equation for this result.
c. Interpret the regression coefficient of Sex
d. Interpret the regression coefficient of BMI
e. Interpret the coefficient of determination of the model and what can you infer from this parameter.
6.What is the distribution of dependent variable so as to apply logistic regression model?
7.When we test significance of difference in an outcome between three groups of intervention control treatment 1 and 2 do we need to adjust for multiple comparisons? Why?
8.You are required to analyse data to examine the association between the OHIS oral hygiene index simplified with values ranging from 0 to 6 with two decimals and multiple risk factors (environmental, socio-demographic and lifestyle factors etc).What would be your preferred method of analysis?
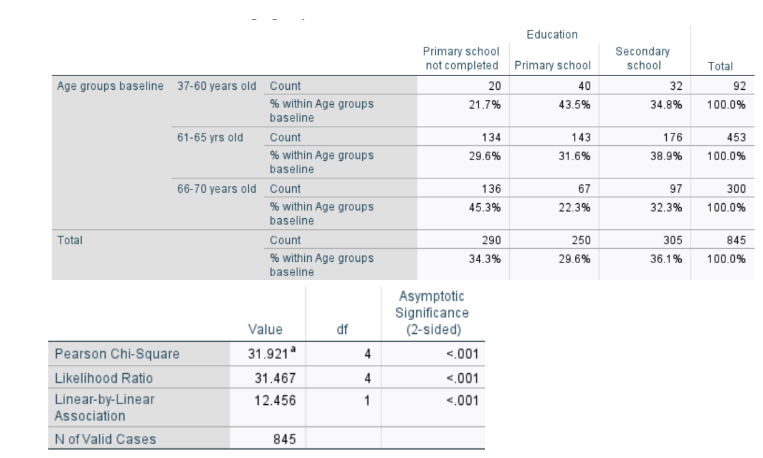
The result below is from a study analysis:
a. What is the name of test statistics or statistical method?
b. What is p-value?
c. Is it significant?
6002HLS Structure And Requirement Assignment
10.We test the difference between the baseline quality of life score with each of the
7 repeated measures of quality of life score:
a. What is the alpha (significant level) of the test?
b. What is the main assumption to be met?
c. What is the statistic test when assumption met?
ORDER This 6002HLS Structure And Requirement Assignment NOW And Get Instant Discount

Read More :
